Cash-on-cash return vs cap rate vs IRR (and DSCR): which number to trust
Rental listings and forums throw around four numbers: cap rate, cash-on-cash return, DSCR and IRR. They answer different questions, so the same property can look like a bargain on one and a dud on another. Here's what each measures, what it leaves out, and how to use them together.
1. Four numbers, four questions
| Number | How it's worked out | The question it answers | What it ignores |
|---|---|---|---|
| Cap rate | Net operating income ÷ what the property costs | How much does the property earn, before any loan? | Your financing, taxes, appreciation |
| Cash-on-cash return | Yearly cash flow after the mortgage ÷ the cash you put in | What does my money earn in cash in year one? | Loan paydown, appreciation, taxes, later years |
| DSCR (debt service coverage ratio) | Net operating income ÷ yearly mortgage payments | Does the rent comfortably cover the loan? | Your return, your down payment |
| IRR (internal rate of return) | The yearly return that matches all your cash in and out, including the sale | What does the whole investment earn over the years I hold it? | Nothing in principle, but it's only as good as its assumptions |
Net operating income (NOI) is the rent you actually collect, less running costs (property tax, insurance, management, repairs), before mortgage payments.
2. One rental, four verdicts
Take a $285,000 single-family house that needs $12,000 of work before renting.
- Financing: 25% down; a 30-year loan at 7.25% with one point; 2.5% closing costs.
- Income: $2,650 a month in rent, with 6% lost to vacancy.
- Costs: property tax of 1.1% of the price and $1,650 a year for insurance. Maintenance, a reserve for big replacements (roof, furnace) and management take 6%, 8% and 9% of rent collected.
The year-one figures:
- Rent collected: $30,174. Running costs: $9,311. NOI: $20,863.
- Reserve for big replacements: $2,414. Mortgage payments: $17,498 ($1,458 a month).
- Cash flow left over: $951 a year, about $79 a month.
- Cash you put in: $92,513 (down payment, closing costs, the point and the repairs). Total cost of the property: $304,125.
| Number | Result | Verdict on its own |
|---|---|---|
| Cap rate | 6.9% | Reasonable for a single-family rental |
| Cash-on-cash return | 1.0% | Poor: a savings account pays more |
| DSCR | 1.19 | Below the 1.20–1.25 many lenders look for |
| IRR over 10 years, after tax | 8.0% (9.8% before tax) | Decent, if the assumptions hold |
None of these is wrong. Each looks at a different slice of the same deal.
3. Cap rate: the property, not the deal
Cap rate ignores the loan, so it lets you compare properties and markets on equal terms: a 6.9% cap rate means the house earns 6.9% of its cost before financing. That makes it a good first screen and a poor final answer.
Two things to watch in quoted cap rates:
- What it's divided by. Listings divide by the asking price. Dividing by your full cost, including repairs and closing, is more honest. Here that's the difference between 7.3% and 6.9%.
- What NOI leaves out. A seller's NOI often skips management, vacancy or repairs. Rebuild it with your own costs before you trust the cap rate.
4. Cash-on-cash: what your money earns now
Cash-on-cash includes the mortgage, so it tells you whether the property pays you to own it. At 1.0% this one barely does. The reason is the loan: each year the payments cost 8.2% of the amount borrowed (the "mortgage constant": $17,498 ÷ $213,750). The property only earns 6.9%, so every borrowed dollar costs more than it brings in. Investors call this negative leverage.
Two changes show how sensitive it is. At a 6.25% rate, cash-on-cash rises to 2.9%. With rent of $2,900 instead of $2,650, it rises to 3.4%.
What cash-on-cash leaves out is real money too: the loan balance you pay down each year, any rise in the home's value, and tax effects such as depreciation. It's also a snapshot of year one only.
5. DSCR: the lender's number
A DSCR of 1.19 means the NOI covers the mortgage payments 1.19 times over. A lender reads it as a safety margin: at 1.0, the rent only just covers the loan.
- Many lenders look for 1.20 to 1.25 on rental loans. Some "DSCR loan" programs accept less, at a higher rate.
- Lenders don't all define it the same way. Some divide gross rent by the full payment, including property tax, insurance and HOA dues. Ask how yours does it before you count on qualifying.
For you, DSCR is a quick survival check: the lower it is, the less room you have for a vacancy or a big repair.
6. IRR: the whole picture, if the assumptions hold
IRR counts everything over the time you hold the property:
- the cash you put in;
- each year's cash flow, after tax;
- loan paydown and appreciation, which you collect when you sell;
- selling costs and the tax at sale, including depreciation recapture.
Over 10 years, this example assumes rents rise 3% a year, costs 3.5% and the home's value 3%. With those assumptions it returns 8.0% a year after tax.
That figure leans heavily on appreciation. With no rise in value, the same deal returns 2.1% a year after tax. At 1% a year, it returns 4.1%. The rent, the cap rate and the cash-on-cash return don't change at all. So when the IRR looks good but cash flow is thin, most of the return is a bet on the home's future price. That bet may well pay off, but it's a different bet from a property that pays its own way.
7. What borrowing does to each number
Buy the same house with cash and the numbers flip:
- Cash-on-cash jumps from 1.0% to 6.1%, because there's no loan to pay.
- After-tax IRR falls from 8.0% to 6.5%. Your gain from appreciation is now spread over the full price instead of a 25% down payment.
- DSCR no longer applies, since there's no loan.
- Cap rate doesn't move, because it never counted the loan.
Borrowing raises the expected return and the risk together. It's at its riskiest when, as here, the loan costs more than the property earns.
8. Using them together
- Screen with cap rate, using your own cost and NOI figures, not the listing's.
- Check that the deal survives with cash flow and DSCR. Re-run them with a vacancy, a big repair or a higher rate. A deal that needs everything to go right can't absorb a bad year.
- Decide with after-tax IRR, at a cautious appreciation figure, and look at how much of the return depends on it.
- Compare against your other choices. An 8% IRR that depends on appreciation is a different thing from 8% from an index fund you never have to fix.
Thin year-one cash flow doesn't rule out a rental. Some investors accept it in exchange for appreciation, especially if a lower rate or rising rents improve it later. The point is to know which kind of deal you're buying.
Try it with your numbers
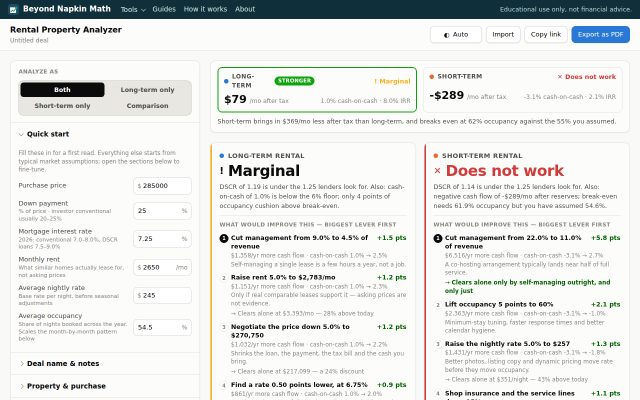
The Rental Property Analyzer opens with this example loaded. Its year-one scorecard shows all four numbers side by side, after tax. The rest of the page shows:
- stress tests and a rent-by-interest-rate table that show what breaks the deal;
- a ten-year projection with the sale at the end;
- a long-term vs short-term rental comparison, if you want one.
It runs in your browser and we don't store your numbers.
 Run your own numbers
Rental Property Analyzer
Long-term vs short-term rental: cash flow, returns and taxes, side by side.
Open the tool →
Run your own numbers
Rental Property Analyzer
Long-term vs short-term rental: cash flow, returns and taxes, side by side.
Open the tool →