How the Rent vs Buy Calculator works
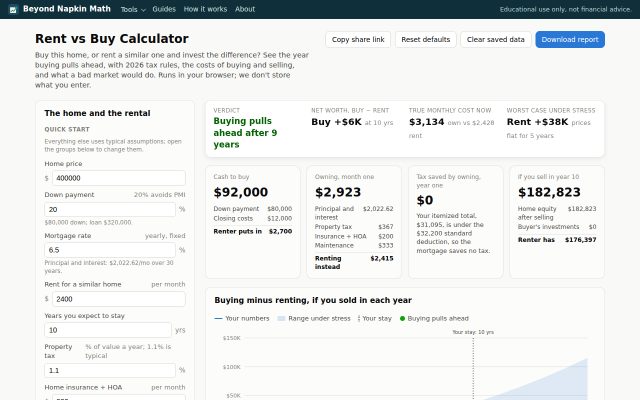
The Rent vs Buy Calculator follows two households with the same starting cash and the same monthly budget. One buys the home; the other rents a similar one and invests whatever it doesn't spend. At the end of each year it asks what each would have if the buyer sold that year. This page explains each step and what the model leaves out.
Two households, one budget
On day one the buyer pays the down payment, closing costs, any points and any move-in costs. The renter pays a security deposit and any broker or application fees, and invests the rest of the same cash.
Every month after that, the model adds up what each household pays:
- Buyer: the mortgage payment (principal and interest), PMI while it lasts, property tax, home insurance and HOA, and maintenance, less the income tax that owning saves.
- Renter: rent and renter's insurance.
Whichever path costs less that month invests the difference. Early on that is usually the renter. Rent rises over time while the mortgage payment doesn't, so later it is often the buyer. Both portfolios earn your investment return, compounded monthly. This is the fair comparison: a renter who spends the difference instead of investing it will do worse than shown.
If you sold this year
At the end of each year the model works out each household's net worth as if the buyer sold then:
- Buyer: the home's value, less selling costs, less the loan balance, less any tax on the gain, plus the buyer's own investments after tax on their gains.
- Renter: the investments after tax on their gains, plus the deposit back.
The difference is the line on the chart. The break-even year is the first year from which buying stays ahead. The model runs at least 30 years so it can tell you when buying would win, even if that's after you plan to move.
The mortgage
The payment is the standard fixed-rate formula, rounded to the cent as lenders do; the final payment is trued up so the loan ends at exactly zero. Interest each month is the balance times the yearly rate divided by 12.
PMI is a yearly percentage of the original loan, charged when you put down less than 20%. Under the federal Homeowners Protection Act it can be cancelled at your request once the balance reaches 80% of the price you paid, and it ends automatically at 78% on the original schedule. The calculator assumes you ask at 80% unless you untick the box.
The tax saving from owning
Owning only saves income tax if you itemize, and you itemize only when your deductions beat the standard deduction. For each year the model works out your federal income tax twice, as a renter and as an owner, and the saving is the difference:
- Both households take the larger of the standard deduction ($32,200 married filing jointly, $16,100 single, $24,150 head of household in 2026) and their itemized deductions.
- The renter's itemized deductions are state and local income tax (up to the SALT cap) and your other itemized deductions.
- The owner adds property tax (inside the same SALT cap), mortgage interest, points in the year of purchase and, from 2026, mortgage insurance.
- Mortgage interest is deductible on up to $750,000 of loan ($375,000 married filing separately). On a larger loan the deductible share is $750,000 divided by the balance at the start of the year.
- Mortgage insurance is deductible again from 2026, but the old income limit still applies: 10% less for every $1,000 of income over $100,000, so none above $109,000 ($50,000 and $500 steps if married filing separately).
The SALT cap. For 2026 the cap on state and local tax deductions is $40,400 ($20,200 married filing separately). It is cut by 30% of income over $505,000, but not below $10,000. Under current law the cap and threshold rise 1% a year through 2029, and from 2030 the cap is a flat $10,000. The model follows that schedule, so a long stay sees the saving shrink in 2030.
The tax is the 2026 federal brackets applied to your income less the deduction. Income, brackets and the standard deduction rise with your inflation assumption in later years (the IRS uses a slightly different inflation measure and rounds, so later years are estimates). The model counts the saving in the year it arises. A household that already itemizes, with large state taxes or charitable giving, gets more from the mortgage than one that doesn't, which is why "Other itemized deductions" is an input.
Tax on gains
The home. The gain is the sale price less selling costs, less the price paid and closing costs. If you've owned and lived in the home for 2 of the last 5 years, up to $250,000 of gain is tax-free, or $500,000 for a married couple filing jointly (Section 121). These amounts aren't adjusted for inflation. The model applies the exclusion from year 2 if the box is ticked, and taxes the rest of the gain at your tax-on-gains rate. Selling sooner after a job move, health reason or other unforeseen event can qualify for a partial exclusion, which the model leaves out.
The investments. Gains are taxed once, when the portfolio is cashed out. In a tax-advantaged account (a 401(k), IRA or Roth) there is no tax on them. In practice dividends are taxed every year; the model ignores that small drag.
The rate. Left blank, the tax-on-gains rate is worked out from your year-one income: the federal long-term rate for your taxable income (0% up to $98,900 married filing jointly in 2026, 15% up to $613,700, then 20%), plus the 3.8% net investment income tax if your income is over $250,000 ($200,000 single), plus your state income tax rate. A large gain in a single year can push part of it into a higher band; the model uses one rate, so type your own if you expect that.
Growth and today's dollars
The home's value grows at your home price growth rate, compounded monthly. Rent rises once a year at the rent growth rate. Property tax and maintenance are a percentage of the home's value at the start of each year, so they grow with it. Insurance, HOA, renter's insurance, the stress-test repair and your income rise with inflation.
Every result is shown in today's dollars: each year's figures are divided by inflation compounded to that year. That keeps a 2036 dollar comparable with a dollar today. The investment return is entered before inflation, the way returns are usually quoted.
True monthly cost
The scoreboard's "true monthly cost" counts what you pay and don't get back in month one. For owning: interest, PMI, property tax, insurance and HOA, and maintenance, less tax saved, plus what the down payment and closing costs would have earned invested (at your return, after tax on gains). For renting: rent, renter's insurance, and what the deposit would have earned. Principal isn't a cost, because you get it back when you sell, and expected price growth isn't subtracted. The full comparison, including both, is the net-worth result.
Stress tests
Each stress test reruns the whole model with one change:
- Prices flat for 5 years: no home price growth in years 1–5, then your growth rate.
- Prices fall 10% in year 1: then your growth rate from year 2.
- Forced to sell in year 3: your numbers, but you sell after 3 years.
- Rents rise 2 points faster: which helps the buyer.
- Investments earn 2 points less: which also helps the buyer.
- A $15,000 repair in year 5: in today's dollars, paid at the start of year 5. Skipped if you plan to move sooner.
The scoreboard's worst case is the lowest buy-minus-rent result among them. The shaded band on the chart is the range across the full-length cases (all but the forced sale, which is a point on the main line). Mortgage rates 2 points higher when you sell aren't modelled: higher rates mean buyers can borrow less, which tends to weigh on prices, so the calculator reports what each 1% off your sale price would cost you instead.
What this leaves out
- State and local transfer taxes, rent control, and local property tax rules such as California's Prop 13 reassessment limits.
- Refinancing later, adjustable rates and extra payments. The rate is fixed for the whole stay.
- What owning or renting is worth to you: space, stability, flexibility, a landlord who fixes things.
- Estate effects, such as the step-up in basis when a home passes to heirs.
- The 2026 senior deduction, tax credits, the alternative minimum tax, and the partial home-sale exclusion.
- Year-to-year swings in prices and returns. Each case uses a steady rate.
- Improvements that add to the home's basis. Maintenance is treated as a cost that keeps the home in shape, not as an improvement.
Tested by hand
The test suite checks hand-worked figures: the payment on a $400,000 loan at 6.5% over 30 years ($2,528.27), the itemizing test ($20,000 of interest plus $12,000 of SALT is under the $32,200 standard deduction, so owning saves $0), the Section 121 exclusion, the SALT phase-down ($25,400 at $555,000 of income; the $10,000 floor at $700,000), selling costs, the PMI cancellation month, and two sanity checks. With no growth, no returns and a cash purchase, the buyer gains exactly the rent each year, $12,000 a year on $1,000 a month. When the owner's costs equal rent and the home grows at the investment return with no taxes or transaction costs, both households finish level.
 Try it
Rent vs Buy Calculator
After how many years does buying beat renting and investing the difference?
Open the tool →
Try it
Rent vs Buy Calculator
After how many years does buying beat renting and investing the difference?
Open the tool →