How the Rental Property Analyzer works
The Rental Property Analyzer underwrites one property as a long-term rental, a short-term rental, or both side by side, over a hold period you choose. This page explains how each number is built.
Revenue
Long-term rental: monthly rent plus other income (pet rent, parking, laundry), times 12, minus a vacancy and credit-loss allowance.
Short-term rental: built month by month. Each month's nights booked are that month's occupancy times its days; room revenue is nights times the average daily rate, adjusted by that month's seasonal multiplier. The number of stays is nights divided by the average length of stay, and each stay adds the cleaning fee you charge. The quick-start "average occupancy" field rescales every month by the same factor, so the seasonal shape is kept (no month goes above 100%). An optional lender haircut (often 20–25%) reduces projected short-term revenue the way many lenders do.
Operating costs
- Fixed costs: property tax, insurance, HOA, utilities, internet, yard and pool care, permits and other fixed costs. Short-term rentals usually carry higher insurance and pay all utilities.
- Revenue-linked costs: property management, maintenance and a capital-expenditure reserve (roof, HVAC, flooring), each as a percentage of revenue. Short-term rentals add the platform fee.
- Per-stay costs for short-term rentals: cleaning paid to your cleaner and consumables, times the number of stays.
- Mortgage insurance while the loan is above 80% of the property's value, if you enter a rate.
Revenue and costs grow each year at the rates you set. Costs usually grow faster than rent, especially insurance and taxes.
The key numbers
| Measure | How it's calculated |
|---|---|
| Net operating income (NOI) | Revenue minus operating costs, before the capital reserve, the basis lenders use so cap rates stay comparable to the market |
| Cap rate | Year-one NOI ÷ all-in cost (price, rehab, closing costs and, for short-term rentals, furnishing) |
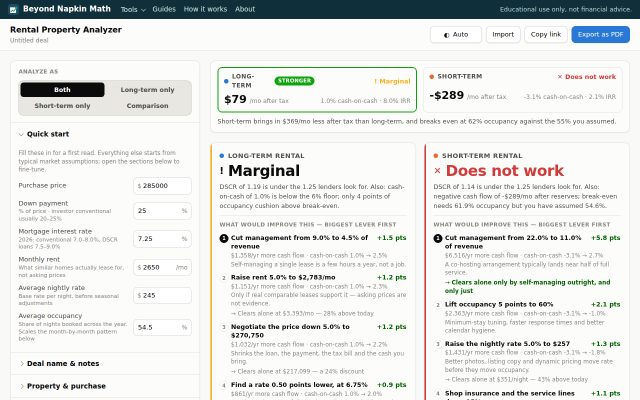
| Debt service coverage (DSCR) | NOI ÷ annual loan payments. Lenders typically look for 1.25 or more; below 1.0 the property can't cover its own mortgage |
| Cash flow | NOI minus the capital reserve minus loan payments: the cash you actually keep |
| Cash-on-cash return | Year-one cash flow ÷ cash invested (down payment, closing costs, points, rehab, furnishing) |
| Break-even occupancy | The occupancy at which cash flow reaches zero, compared with the occupancy you assumed |
| IRR | The annual return that makes the cash invested, every year's cash flow and the sale proceeds net to zero, shown before and after tax |
The loan is amortized month by month, so interest, principal and the remaining balance are exact for every year of the hold, including interest-only loans.
Taxes
- Depreciation: the building (price, rehab and closing costs, minus the land share) is depreciated straight-line over 27.5 years. An optional cost-segregation study moves part of the basis into shorter-lived property, which can take bonus depreciation (100% for property acquired after January 19, 2025). Short-term rental furnishings are depreciated the same way.
- Losses: a tax loss is usually passive, so it is suspended and carried forward to offset future rental income or the gain on sale. You can let losses offset other income if you qualify: for long-term rentals through real-estate-professional status or the active-participation allowance; for short-term rentals with an average stay of seven nights or less plus material participation.
- On sale: depreciation taken is taxed at the recapture rate (25% by default), the remaining gain at your capital gains rate, and any suspended losses are released.
Tax handling is simplified: federal only, no mid-month convention, and no net investment income tax.
The exit
At the end of the hold, the property is sold at its appreciated value, or, if you choose, at final-year NOI divided by an exit cap rate. Selling costs and the remaining loan balance are deducted, then the taxes above. The tool also shows the after-tax result of selling in each earlier year.
Verdict, sensitivity and stress tests
The verdict checks coverage (DSCR against 1.25), cash-on-cash return against 8%, and how much occupancy cushion sits above break-even. Sensitivity tables show which inputs move the result most. Stress tests rerun the deal with interest rates up 2 points, revenue down 10%, a demand shock (vacancy to 15% and short-term occupancy down 15 points), operating costs up 20%, and a recession combining softer versions of all of these with no appreciation.
A short-term rental risk checklist (primary-residence rules, HOA bans, night caps, permits, pending rules, oversupply, single-season markets) flags regulatory problems that no amount of good arithmetic can fix.
What the model does not cover
- State income tax, the net investment income tax and the mid-month depreciation convention.
- Your specific market: every default is a starting point from published ranges, not a quote for your property.
- Whether you actually qualify for the tax treatments above. That depends on facts a tax professional should confirm.
- Local short-term rental rules, which change often.
The figures the model uses, and when they were last reviewed, are listed on Sources and updates.
 Try it
Rental Property Analyzer
Long-term vs short-term rental: cash flow, returns and taxes, side by side.
Open the tool →
Try it
Rental Property Analyzer
Long-term vs short-term rental: cash flow, returns and taxes, side by side.
Open the tool →