How the Retirement Plan Explorer works
The Retirement Plan Explorer projects your savings year by year and finds the first year your portfolio is large enough to pay for the retirement you describe. This page explains every step, so you can judge the answer rather than take it on trust.
Everything is in today's dollars
Every return, raise and cost is an after-inflation (real) figure. "$8,000 a month" means $8,000 of today's purchasing power, whichever year you retire. This avoids the most common mistake in retirement calculators: growing savings at a nominal rate while comparing them against spending in today's prices.
Three kinds of account, tracked separately
Where a dollar lives changes how it grows and when you can spend it, so the model keeps three buckets:
| Account | Growth | Usable before the access age? |
|---|---|---|
| Traditional 401(k) / 403(b) | Full return, minus fees | Not without a penalty, unless you use a Roth conversion ladder, a 72(t) plan or the Rule of 55 |
| Roth IRA / Roth 401(k) | Full return, minus fees | Only the money you put in (contributions); growth waits |
| Regular (taxable) investment account, plus vested company stock | Return minus fees and a yearly tax drag on dividends and rebalancing | Yes, anytime |
Each year, savings are routed against real contribution room: your 401(k) deferral up to the annual limit, plus any employer contribution (which doesn't count against your limit), then IRA room, assumed to go to a Roth. Whatever is left can only go to the regular investment account. At high savings rates that is most of the money.
Your yearly savings
Salary is taxed at your overall rate; bonus and stock pay are taxed at your top rate, because they sit on top of your salary. From what's left, the model subtracts living costs, health insurance, childcare, and mortgage payments. The mortgage is paid down month by month, so extra payments shorten the loan and the payoff year is real. Property tax, insurance and upkeep continue after the mortgage ends.
How much you need: a withdrawal rate that follows retirement length
The familiar "4% rule" was calibrated on 30-year retirements. Longer retirements must survive more market cycles, so a lower rate is safer. Unless you set your own, the model picks the rate from how long your retirement would last:
| Retirement length | Withdrawal rate used |
|---|---|
| 20 years or less | 4.5% |
| 21–30 years | 4.0% |
| 31–35 years | 3.7% |
| 36–40 years | 3.5% |
| 41–50 years | 3.25% |
| More than 50 years | 3.0% |
The amount you need is your yearly spending (lifestyle + healthcare + property costs), grossed up for tax if you entered it as money to spend, minus Social Security, divided by that rate. Because retiring earlier means a longer retirement and a lower rate, the target is higher the earlier you retire. The tool compares each year's balance against that year's target.
The early-access bridge
If you retire before you can use retirement accounts without penalty (59½ by default, or the age you enter), you have to live on money you can reach. The model counts your regular investment account plus your Roth contributions (not their growth) at your retirement date, and compares that with your spending until the access age, plus any extra costs you entered for those years. If it falls short, the tool flags the gap and the usual ways to close it.
Extra costs that end at the access age are added to your target as a lump sum, because they are a fixed amount for a fixed number of years rather than a lifelong expense.
Social Security
Benefits use the official 2026 formula. Each year you work counts your pay (salary, bonus and stock pay, which are all wages for Social Security) up to that year's taxable maximum ($184,500 in 2026). Future years follow the pay path the tool projects; past years use the typical yearly pay you enter, or your current pay if you leave it at zero. The best 35 years are averaged, run through the two "bend points," and adjusted for the age you claim (reduced before 67, increased by 8% a year for waiting up to 70). Retiring early leaves zero-earning years in that average, which the model counts. Because benefits start at your claiming age, not your retirement date, they are spread across the whole retirement as an average. That is a simplification.
Stress tests
The main projection uses one steady return. Real markets arrive in an order, and a bad decade just before retirement hurts far more than the same decade early on. The tool reruns your plan under five sequences (steady returns, a lost decade now, a lost decade just before retiring, a 1966-style 16-year stagnation, and a crash in the final two years) and shows how far each one moves your date.
What the model does not cover
- Market randomness as a probability. It uses fixed scenarios, not thousands of random simulations.
- Your exact Social Security record. Past years are approximated by one typical pay figure, and spousal and survivor benefits by a single number you enter. Your actual earnings record and estimate are at ssa.gov.
- Catch-up contributions for people 50 and over, and other plan-specific rules.
- State taxes beyond the single overall rates you enter, and the detailed order in which you withdraw from each account.
- Healthcare costs rising faster than general inflation, which they historically have.
- The five-year rules for Roth conversions and the details of 72(t) plans.
The figures the model uses, and when they were last reviewed, are listed on Sources and updates.
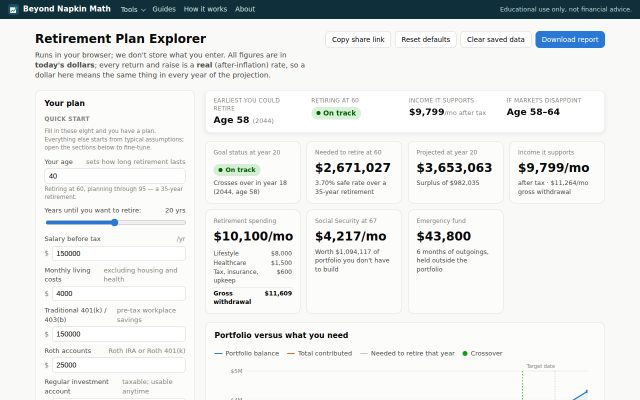 Try it
Retirement Plan Explorer
When could you retire? 401(k), Roth and taxable savings, in today's dollars.
Open the tool →
Try it
Retirement Plan Explorer
When could you retire? 401(k), Roth and taxable savings, in today's dollars.
Open the tool →