How the Social Security Claiming Age Calculator works
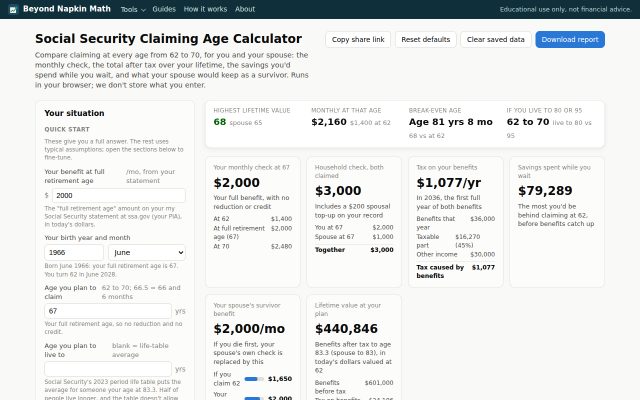
The Social Security Claiming Age Calculator runs your household's benefits month by month, for every claiming age from 62 to 70, and compares what each one pays over your lifetime after tax. This page explains each step, every official figure it uses, and what the model leaves out.
What it compares, and what it doesn't claim
The tool reports the claiming age with the highest lifetime value under the assumptions you enter. That is an arithmetic result, not advice, and it moves a lot when the assumptions move: change how long you expect to live, or the return on your savings, and the answer can shift by several years. The scenarios are there to show you that movement rather than to hide it. Social Security is as much insurance against living a long time as it is a bet on how long you'll live, and no calculator can weigh that for you.
Full retirement age
Full retirement age comes from your birth year, under section 216(l) of the Social Security Act:
| Born | Full retirement age |
|---|---|
| 1943–1954 | 66 |
| 1955 | 66 and 2 months |
| 1956 | 66 and 4 months |
| 1957 | 66 and 6 months |
| 1958 | 66 and 8 months |
| 1959 | 66 and 10 months |
| 1960 or later | 67 |
Survivor benefits use their own table, which runs two years behind: 66 for people born 1945–1956, rising to 67 for 1962 and later. SSA treats someone born on January 1 as born the year before; the tool works in whole birth months and doesn't apply that edge rule, so if you were born on the 1st or 2nd of January, check your statement.
Your own benefit
Everything starts from your primary insurance amount (PIA): the monthly benefit you would get at full retirement age, which your my Social Security statement shows. The tool doesn't recompute it from your earnings record — that is what the Retirement Plan Explorer does — because once you are near claiming age, the figure on your statement is better than any estimate.
Claiming early or late adjusts it:
- Early: 5/9 of 1% a month for the first 36 months before full retirement age, then 5/12 of 1% a month. Claiming at 62 with a full retirement age of 67 is 60 months early: 36 × 5/9% + 24 × 5/12% = 30%, so a $2,000 benefit becomes $1,400.
- Late: delayed retirement credits of 2/3 of 1% a month, 8% a year, from full retirement age to 70 and no further. Three years of credits is 24%, so $2,000 becomes $2,480.
Claiming ages outside 62 to 70 are pulled back to the nearest end, with a message. You can enter part-years (66.5 means 66 years and 6 months).
Your spouse
A married person receives the larger of their own benefit or a spousal benefit worth up to 50% of the other spouse's PIA. The tool models this as the own benefit plus a top-up, which is how SSA pays it:
- The top-up is 50% of your spouse's PIA less the claiming spouse's own PIA, and it cannot be negative.
- It can only start once both of you have filed, so a spouse who files first on a small record waits for the higher earner before the top-up begins.
- Claiming it early costs 25/36 of 1% a month for the first 36 months and 5/12 of 1% a month beyond, so 36 months early is a 25% cut and 60 months early is 35%.
- There are no delayed credits on a spousal benefit. Waiting past full retirement age for it gains nothing.
- Deemed filing applies to everyone born on or after January 2, 1954: claiming either benefit claims both. The old "restricted application" strategies are not available to anyone reaching 62 now, and the tool doesn't offer them.
Example, checked in the test suite: a worker with a $2,400 PIA and a spouse with a $600 PIA. At the spouse's full retirement age the top-up is $1,200 − $600 = $600, so the spouse receives $1,200 in all. Claiming at 62 instead, the spouse's own benefit falls 30% to $420 and the top-up falls 35% to $390, for $810.
Survivors
When one of you dies, the survivor receives the larger of their own benefit or a survivor benefit based on the deceased's record. The tool follows the main rules and simplifies the rest:
- The survivor benefit is up to 100% of what the deceased was receiving, including any delayed credits. Waiting therefore raises the survivor's income for the rest of their life, which is often the strongest argument for the higher earner to delay.
- If the deceased claimed early, the survivor gets the larger of that reduced benefit or 82.5% of the deceased's PIA (the widow(er)'s limit).
- If the deceased died before claiming, delayed credits earned up to the month of death count.
- A survivor who starts the benefit early receives less: 71.5% at age 60, rising in a straight line to 100% at survivor full retirement age. The tool starts the survivor benefit at the later of the death and the survivor's planned claiming age, capped at their survivor full retirement age, since nobody gains by waiting past it.
Simplifications here: real survivor claiming has more moving parts — a survivor can take one benefit and switch to the other later, which deemed filing does not prevent for survivor benefits, and benefits for a surviving spouse caring for a child under 16 follow different rules. The tool pays the larger of the two benefits from one start date rather than modeling a switch, so it can understate what a careful survivor claim would achieve.
The earnings test
If you claim before full retirement age and keep working, part of your benefit is held back. For 2026:
- In years before the one you reach full retirement age: $1 held back for every $2 you earn over $24,480 ($2,040 a month).
- In the year you reach it: $1 for every $3 over $65,160, counting only what you earn before the month you reach it.
- From that month on, there is no limit at all.
SSA withholds whole monthly checks until the year's amount is covered, and repays anything over-withheld the following year; the model does the same. Held-back months are not lost: at full retirement age your benefit is recalculated as if you had claimed that many months later, which the tool applies from that month on. Only wages and self-employment income count, not pensions, interest or withdrawals from savings.
The tax on your benefits
Social Security is taxed under Internal Revenue Code section 86, worked out in Worksheet 1 of IRS Publication 915. Your "provisional income" is your other income, plus tax-exempt interest, plus half your benefits. Then:
- Under $25,000 (single or head of household) or $32,000 (married filing jointly): none of your benefits are taxable.
- Between that and $34,000 / $44,000: up to 50% of the amount over the first threshold is taxable.
- Above it: 85% of the amount over the second threshold, plus the smaller of the 50%-tier amount or $4,500 ($6,000 joint), capped at 85% of your benefits.
Worked example, pinned in the test suite: a single filer with $24,000 of benefits and $30,000 of other income has provisional income of $42,000, so the taxable part is the smaller of 85% × $24,000 = $20,400 and 0.85 × ($42,000 − $34,000) + min($4,500, $12,000) = $6,800 + $4,500 = $11,300.
These thresholds are fixed in law. They have not changed since 1984 and 1993 and are not indexed for inflation, so each year a little more of the same real benefit is taxed. Your inflation assumption shrinks them in today's dollars, which is why the taxable share creeps up in the year-by-year table.
The taxable part is then taxed with the 2026 brackets and standard deduction, plus the extra standard deduction for people 65 and over ($1,650 each filing jointly, $2,050 single) and the senior deduction: $6,000 per person aged 65+ for tax years 2025 to 2028 only, reduced by 6% of income over $75,000 ($150,000 joint) and gone at $175,000 ($250,000). It is taken whether or not you itemize and does not change section 86 itself. The model stops it after 2028, as the law does. The figure shown as "tax on your benefits" is the difference between your tax with the benefits and without them. A state rate, if you enter one, is applied to the federally taxable part as a flat rate.
Lifetime value, and why it's discounted
A dollar received at 62 is not the same as a dollar received at 70: the earlier one can sit in savings and earn a return, or — the same thing from the other side — it spares you from spending that much of your savings while you wait. So every total in the tool is the after-tax benefit valued at the month you turn 62, discounted at the real return you enter. With a 0% return it is a plain running total. A higher return favors claiming earlier; this is the single assumption that moves the answer most after life expectancy.
Everything is in today's dollars, so the cost-of-living adjustment is 0% by default: benefits keep pace with inflation, which is what the COLA is designed to do (2.8% for 2026). Set the growth field negative to model a COLA that lags the prices you actually face.
The break-even age is the first age at which the running total from a later claiming age catches the total from the earliest age available to you, with benefits assumed to be paid for as long as it takes. Claiming at 62 against 70 with a $2,000 PIA and a 0% return, that is age 80 and 4 months. A positive return pushes it later.
Life expectancy
Left blank, the ages you live to come from Social Security's 2023 period life table, the one used in the 2026 Trustees Report: a 62-year-old man averages 20.3 more years, a woman 23.1. A period table applies today's death rates at every future age, so it does not allow for further gains in longevity and runs a little short for a healthy person. Half of people outlive their life expectancy, which is why the tool always shows the answer at three life spans rather than one.
The scenarios
- You die at 75 and you live to 95: the two ends of the range, with everything else unchanged.
- Your spouse outlives you by 10 years: your spouse's remaining years on a survivor benefit, which is where delaying pays off most.
- Benefits cut from 2034: a scenario, not a prediction. The 2026 Trustees Report projects the combined trust funds run out in the third quarter of 2034, after which continuing income would cover about 83% of scheduled benefits; the retirement fund alone is projected to run out in late 2032 at 78%. Congress has acted before every past shortfall, and any change could fall differently on different ages or incomes. The default 20% cut from 2034 is a round illustration, and you can change both numbers.
- A 0% real return: savings that only keep pace with inflation, which favors waiting.
Each scenario reruns every claiming age and reports the best one, so you can see how far the answer travels.
What this leaves out
- Divorced-spouse and child benefits. A marriage of ten years or more can entitle you to benefits on an ex-spouse's record without affecting theirs; that isn't modeled.
- Disability benefits and the rules that convert them at full retirement age.
- WEP and GPO. The Windfall Elimination Provision and Government Pension Offset were repealed by the Social Security Fairness Act (Public Law 118-273, signed January 5, 2025) for benefits payable after December 2023, so a pension from work not covered by Social Security no longer reduces your benefit. Nothing here needs to adjust for them.
- Medicare IRMAA. Higher income raises your Medicare Part B and D premiums, which are deducted from your Social Security check, two years in arrears. Named here because it is a real cost of a large withdrawal in the years you claim, but not modeled.
- SSA's rounding. Real benefits are rounded down to the dime at each step, and the check you receive is net of Medicare premiums. Expect a difference of a dollar or two.
- Taxes beyond benefits. The tool taxes the benefits, not your whole return: no capital gains, no qualified-dividend rates, no state exemptions for retirement income, no local tax.
- Changes to the law. The senior deduction stops after 2028 because that is what the statute says. Everything else assumes today's rules continue.
- Your health and your plans. A calculator can't price the years you'd rather have the money, or what you know about your own health.
Tested by hand
The test suite (tests/social-security-claiming.test.js, 115 checks) pins the full retirement age table, the reduction at 62 for each birth year against SSA's published percentages, the $1,400 and $2,480 checks above, the break-even at 80 years 4 months with both running totals on either side of it, the spousal and survivor examples, every tier of the Publication 915 worksheet including the $11,300 case, the senior deduction and its phase-out, a full earnings-test year with the recalculation at full retirement age, the life-table defaults, and the edge cases: a claiming age outside 62–70, a life expectancy below the claiming age, a spouse with no record, and a PIA of zero.
 Try it
Social Security Claiming Age Calculator
62, 67 or 70? Every claiming age compared after tax, for both of you.
Open the tool →
Try it
Social Security Claiming Age Calculator
62, 67 or 70? Every claiming age compared after tax, for both of you.
Open the tool →