Sequence of returns risk: why the order of market returns matters more than the average
Retirement calculators usually assume the same return every year. Real markets don't work that way, and when you retire turns out to matter as much as how markets do on average. A bad stretch in the first few years of retirement does far more damage than the same stretch later. This is called sequence of returns risk. Here is a worked example, so you can see the effect in numbers.
1. Same returns, opposite order
Two retirees each start with $1,000,000 and withdraw $40,000 a year (4%, held steady in today's dollars). Both live through the same 15 years of stock market returns, after inflation. One gets the bad years first. The other gets them last.
- Retiree A sees: −26%, −14%, +2%, +10%, +19%, +27%, +8%, −3%, +15%, +22%, +11%, +6%, +18%, +9%, +13%.
- Retiree B sees the same 15 numbers in reverse order.
The returns are made up for this example, not historical. They average 7.8% a year and compound to 6.9% a year, and both retirees get exactly that. Withdrawals come out at the start of each year.
| After | Retiree A (bad years first) | Retiree B (bad years last) |
|---|---|---|
| Year 1 | $710,400 | $1,084,800 |
| Year 3 | $547,275 | $1,296,622 |
| Year 10 | $857,817 | $2,382,255 |
| Year 15 | $1,184,302 | $1,880,651 |
Same returns, same withdrawals, and after 15 years one has 37% less. Without any withdrawals, both would end at exactly $2,712,331, because multiplying the same growth factors in a different order gives the same answer. The order only matters because money is coming out.
2. Why the order matters
When markets fall early, you're still selling investments to pay your bills. Those sales happen at low prices, so fewer shares are left to recover when markets rebound. Retiree A's market losses add up to 35% over the first three years, and after her withdrawals her balance is down 45%. The $40,000 she takes out at the start of year 3 is 6.9% of what's left, not 4%. Retiree B's withdrawal at the same point is 3.5% of his balance. Each of A's withdrawals does more damage, because it's a larger share of a smaller pot.
3. Over a full retirement
Keep going for 30 years, with returns of 5% a year after year 15, and the gap grows:
| Yearly withdrawal | Retiree A after 30 years | Retiree B after 30 years |
|---|---|---|
| $40,000 (4%) | $1,555,779 | $3,003,439 |
| $50,000 (5%) | $535,038 | $2,344,613 |
At a 5% withdrawal rate, retiree A ends with about half of the starting $1,000,000 after 30 years of inflation-adjusted spending, and retiree B ends with more than twice it. Neither runs out in this example, but A wouldn't need much more bad luck to do so.
4. When it hits hardest
The danger zone is roughly the five years before and after you stop working. That's when your balance is at its largest, so a large loss is a large dollar loss, and when you have the least time to make it back. Someone in their 30s who suffers the same losses keeps contributing while prices are low, which helps. Someone drawing money out does the opposite.
The Retirement Plan Explorer's "If the returns don't cooperate" panel reruns your plan under five bad sequences. For the example household in our retire at 50 guide spending $5,000 a month, the steady-return plan reaches its goal at 54. A lost decade of negative returns delays that to 56, and 16 years of zero real return (a 1966-style stagnation) delays it to 58.
5. What helps
Using retiree A's returns and 30 years, as above:
| Strategy | Retiree A after 30 years |
|---|---|
| Withdraw $40,000 a year, no matter what | $1,555,779 |
| Cut spending 10% in years 1 to 3 ($36,000), then back to $40,000 | $1,644,255 |
| Cut spending 20% in years 1 to 3 ($32,000), then back to $40,000 | $1,732,731 |
| Cut spending 10% in any year when the withdrawal is more than 5% of the balance | $1,792,133 |
| Start at a lower rate: $32,500 a year (3.25%) | $2,321,334 |
- A lower starting withdrawal rate is the strongest protection. It's why the Retirement Plan Explorer uses a lower rate for a longer retirement.
- Flexible spending helps more than it looks like it should. A modest, temporary cut when markets are down lets the portfolio recover with more shares. Rules that tie spending to the balance ("cut 10% if withdrawals pass 5% of the balance") are sometimes called guardrails.
- Other income early on, such as part-time work in the first few years, has the same effect as a spending cut.
- A cash or bond buffer, enough for a year or two of spending, lets you avoid selling stocks at the bottom. It isn't free, though: money held back earns less in good years, and it can't prevent a long slump.
- Waiting a year or two to retire, or to claim Social Security, shortens the time you rely on the portfolio.
6. What this example leaves out
- The returns are invented, and 15 years is a short run. Real sequences vary a lot, and the worst ones in history are different from this one.
- It uses a single stock-like return, with no taxes, fees or bonds.
- The Retirement Plan Explorer uses a handful of fixed scenarios, not thousands of random simulations, so it shows how far a bad sequence could move your plan, not the odds of one happening.
Try it with your numbers
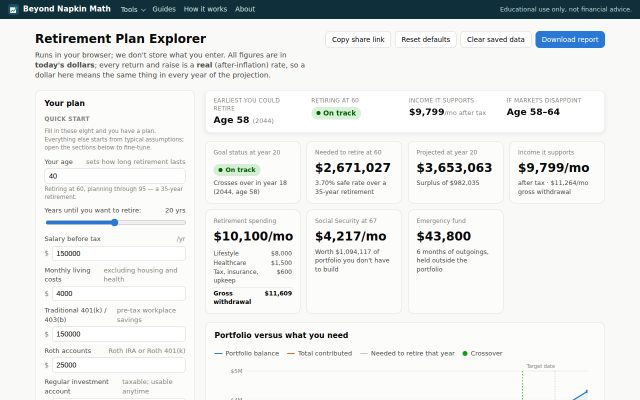
The Retirement Plan Explorer opens with the $5,000-a-month example above. Replace it with your own details, then check the stress-test panel to see how many years a bad sequence adds to your date. It runs in your browser and we don't store your numbers.
This is an illustration, not a forecast or advice.
 Run your own numbers
Retirement Plan Explorer
When could you retire? 401(k), Roth and taxable savings, in today's dollars.
Open the tool →
Run your own numbers
Retirement Plan Explorer
When could you retire? 401(k), Roth and taxable savings, in today's dollars.
Open the tool →