Airbnb break-even: the occupancy and nightly rate you need
Short-term rental projections usually lead with gross revenue: "$58,000 a year!" The number that decides whether you'll be paying the mortgage out of your own pocket is break-even occupancy: the share of nights you must book, at your nightly rate, to cover every cost. For many properties it's higher than the market will give.
1. Why short-term rentals cost so much more to run
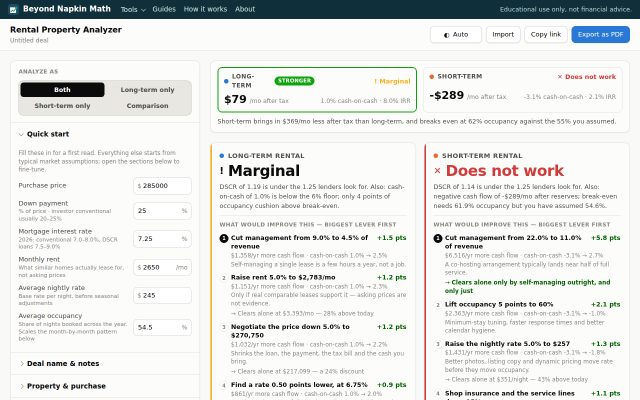
The same $285,000 house, financed with 25% down at 7.25%, as a furnished short-term rental at $245 a night and 54.5% occupancy:
- Revenue: about $57,800 a year, more than twice the $29,900 it would earn on a lease.
- But costs per stay: cleaning, supplies, platform fees, and turnover every three nights.
- Higher running costs: 22% for a short-term rental manager instead of 9%, utilities, internet, yard care, a permit, higher insurance and more wear.
- $19,000 of furniture before the first guest.
Result: it loses about $357 a month after reserves, and needs 63.8% occupancy to break even.
2. The table that matters
Monthly cash flow after reserves, by nightly rate and occupancy:
| Nightly rate | 45% | 55% | 65% | 75% | Break-even occupancy |
|---|---|---|---|---|---|
| $200 | −$1,071 | −$767 | −$464 | −$160 | 80.3% |
| $225 | −$876 | −$529 | −$182 | $166 | 70.2% |
| $245 | −$720 | −$338 | $44 | $426 | 63.8% |
| $275 | −$486 | −$52 | $382 | $816 | 56.2% |
| $300 | −$291 | $187 | $664 | $1,142 | 51.1% |
A $30 difference in nightly rate moves break-even by 7 to 10 points of occupancy. Getting the rate right matters as much as getting bookings.
3. Where to get realistic numbers
- Comparable listings: look at similar places nearby on the booking sites, and at their calendars across a whole year, not just the next few weeks.
- Market data services estimate occupancy and average daily rate by area. Use the median, not the top performers in their marketing.
- Average, not peak. Many markets average somewhere in the 50s for occupancy across the year. A projection of 75% needs a reason.
4. Seasonality
Most markets have busy and slow months, and the busy months usually carry higher rates too. With a typical shape (around 74% occupancy at peak, under 40% in the slowest month, rates 20% higher in summer) and the same 54.6% average occupancy, the loss shrinks from $357 to $289 a month, and break-even falls to 61.9%. But the slow months need cash to get through: budget for the worst month, not the average.
5. Before you buy for short-term rental
- Check that short stays are legal for that address, and will stay legal. See when short-term rental rules kill the deal.
- Compare with a plain lease on the same house; see long-term vs short-term rental.
- Count your time, if you self-manage. A 22% manager's fee is roughly what the work is worth.
What this leaves out
Occupancy and rates are inputs, not forecasts. The model uses a fixed average stay; shorter stays mean more cleaning and turnover. Local lodging taxes are usually collected by the platform and aren't counted as revenue or cost.
Try it with your numbers
The Rental Property Analyzer opens with this house as a short-term rental. Enter the nightly rate, occupancy by month and your costs per stay. It shows break-even occupancy, a nightly-rate-by-occupancy table like the one above, and the same house on a long-term lease. It runs in your browser and we don't store your numbers.
More guides for this tool
- Can rental losses offset your W-2 income?
- Cash-on-cash return vs cap rate vs IRR (and DSCR): which number to trust
- How DSCR lenders size a rental loan
- How much to budget for vacancy, repairs and capex on a rental
- How to stress-test a rental before you buy
- Long-term vs. short-term rental: how to compare the numbers
- Pay cash or finance a rental property?
- Rental property depreciation, cost segregation and recapture, in plain English
- The 1% rule is napkin math. What to check instead
- When short-term rental rules kill the deal
 Run your own numbers
Rental Property Analyzer
Long-term vs short-term rental: cash flow, returns and taxes, side by side.
Open the tool →
Run your own numbers
Rental Property Analyzer
Long-term vs short-term rental: cash flow, returns and taxes, side by side.
Open the tool →